Particle Analysis
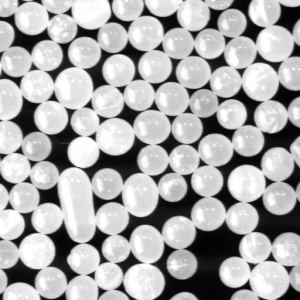
This example chains several classic image processing algorithms, and extracts features of particles contained in a grayscale image.
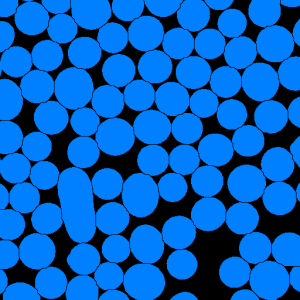
The first step of this example consists in binarizing the input grayscale image.
The ThresholdingByCriterion algorithm is used to set all pixels with an intensity greater than 128 to 1
and the rest to 0.
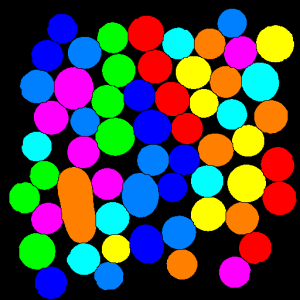
Then the SeparateObjects algorithm is applied to disconnect the connected particles. This method computes a watershed on the distance map to detect isthmuses joining adjacent particles.
Many particles are touching the border of the image field. Since their entire shapes are unknown, these objects would generate a bias when measuring individual features on the particles. Therefore, the BorderKill algorithm is used to remove these objects.
Last, a labelization step is performed to assign a unique value to each set of connected pixels. In this way all particles are identified.
Figure 1. Particle segmentation (a) the initial image, (b) the thresholding result,
(c) watershed based separation and (d) final image after rejecting border objects and labelization
Once this segmentation phase is done, the analysis algorithm is launched after having selected four measurements to compute:
Note:
More than 250 other measurements are also available and described in the Native Measurements section of the ImageDev Reference Guide.
See also
Then the SeparateObjects algorithm is applied to disconnect the connected particles. This method computes a watershed on the distance map to detect isthmuses joining adjacent particles.
Many particles are touching the border of the image field. Since their entire shapes are unknown, these objects would generate a bias when measuring individual features on the particles. Therefore, the BorderKill algorithm is used to remove these objects.
Last, a labelization step is performed to assign a unique value to each set of connected pixels. In this way all particles are identified.
 (a) |
 (b) |
 (c) |
 (d) |
Once this segmentation phase is done, the analysis algorithm is launched after having selected four measurements to compute:
- The X and Y center positions of the particles (the origin is the image top-left corner).
- The equivalent diameter of the particles (that is, the diameter of disks of same area).
- Their mean intensity in the original image.
| Number of particles = 58 | ||||
| Particle | BarycenterX | BarycenterY | EquivalentDiameter | IntensityMean |
| 1 | 395.75 | 39.01 | 49.46 | 206.28 |
| 2 | 105.89 | 48.58 | 50.75 | 225.12 |
| 3 | 248.53 | 56.56 | 61.04 | 227.68 |
| 4 | 192.00 | 63.94 | 52.13 | 212.79 |
| 5 | 469.05 | 74.31 | 63.93 | 229.77 |
Note:
More than 250 other measurements are also available and described in the Native Measurements section of the ImageDev Reference Guide.
#include <ImageDev/Data/AnalysisMsr.h>
#include <ImageDev/Data/NativeMeasurements.h>
#include <ImageDev/ImageDev.h>
#include <ioformat/IOFormat.h>
#include <iolink/view/ImageViewProvider.h>

using namespace imagedev;
using namespace ioformat;
using namespace iolink;

int
main()
{
    // ImageDev library initialization
    if ( imagedev::isInitialized() == false )
        imagedev::init();

    // Open a standard tif file and display the image properties
    auto imageInput = readImage( std::string( IMAGEDEVDATA_IMAGES_FOLDER ) + "balls.tif" );

    // Threshold the grayscale image
    auto imageThr =
        thresholdingByCriterion( imageInput, ThresholdingByCriterion::ComparisonCriterion::GREATER_THAN, 128 );

    // Separate connected particles
    auto imageSep = separateObjects( imageThr,
                                     2,
                                     SeparateObjects::OutputType::SEPARATED_OBJECTS,
                                     SeparateObjects::AlgorithmMode::REPEATABLE,
                                     SeparateObjects::Neighborhood::CONNECTIVITY_26 );
    imageThr.reset();

    // Remove particles touching image borders
    auto imageBdk = borderKill( imageSep, BorderKill::Neighborhood::CONNECTIVITY_26 );
    imageSep.reset();

    // Connected component labeling of a binary image
    auto imageLab =
        labeling2d( imageBdk, Labeling2d::LabelType::LABEL_8_BIT, Labeling2d::Neighborhood::CONNECTIVITY_8 );

    // The number of particles is the maximum label
    auto extrema = intensityExtrema( imageLab, 0 );
    int particleCount = ( int )extrema->maximum( 0, 0, 0 );

    // Define the analysis features to be computed
    AnalysisMsr::Ptr analysis = std::make_shared< AnalysisMsr >();
    auto centerX = analysis->select( NativeMeasurements::barycenterX );
    auto centerY = analysis->select( NativeMeasurements::barycenterY );
    auto diameter = analysis->select( NativeMeasurements::equivalentDiameter );
    auto intensity = analysis->select( NativeMeasurements::intensityMean );

    // Launch the feature extraction on the segmented image
    labelAnalysis( imageLab, imageInput, analysis );
    std::cout << "Number of particles = " << particleCount << std::endl;
    std::cout << "Particle\t" << centerX->name() << "\t" << centerY->name() << "\t"
              << diameter->name() + "\t" + intensity->name() << std::endl;
    // Print the analysis results for 10% of the particles
    for ( int i = 0; i < ( int )( particleCount / 10 ); i++ )
    {
        std::cout << ( i + 1 ) << "\t\t" << centerX->value( i ) << "\t\t" << centerY->value( i ) << "\t\t"
                  << diameter->value( i ) << "\t\t\t" << intensity->value( i ) << std::endl;
    }

    // Save the created image with IOFormat
    writeView( imageLab, R"(T06_01_output.png)" );

    // ImageDev library finalization
    imagedev::finish();

    return 0;
}
using System;
using ImageDev;
using IOLink;
using IOFormat;

namespace T06_01_ParticleAnalysis
{
    class Program
    {
        static void Main( string[] args )
        {
            // ImageDev library initialization
            Initialization.Init();

            // Open a standard tif file and display the image properties
            ImageView imageInput = ViewIO.ReadImage( @"Data/images/polystyrene.tif" );

            // Threshold the grayscale image
            ImageView imageThr = Processing.ThresholdingByCriterion(
                imageInput, ThresholdingByCriterion.ComparisonCriterion.GREATER_THAN, 128 );

            // Separate connected particles
            ImageView imageSep = Processing.SeparateObjects( imageThr, 2 );
            imageThr.Dispose();

            // Remove particles touching image borders
            ImageView imageBdk = Processing.BorderKill( imageSep );
            imageSep.Dispose();

            // Connected component labeling of a binary image
            var imageLab = Processing.Labeling2d( imageBdk,
                                                  Labeling2d.LabelType.LABEL_8_BIT,
                                                  Labeling2d.Neighborhood.CONNECTIVITY_8 );

            // The number of particles is the maximum label
            var extrema = Processing.IntensityExtrema( imageLab, 0 ) as IntensityExtremaMsr;
            int particleCount = ( int )extrema.maximum( 0, 0, 0 );

            // Define the analysis features to be computed
            AnalysisMsr analysis = new AnalysisMsr();
            var centerX = analysis.Select( NativeMeasurements.BarycenterX );
            var centerY = analysis.Select( NativeMeasurements.BarycenterY );
            var diameter = analysis.Select( NativeMeasurements.EquivalentDiameter );
            var intensity = analysis.Select( NativeMeasurements.IntensityMean );

            // Launch the feature extraction on the segmented image
            Processing.LabelAnalysis( imageLab, imageInput, analysis );
            Console.WriteLine( "Number of particles = " + particleCount );
            Console.WriteLine( "Particle\t" + centerX.Name() + "\t" + centerY.Name() + "\t" + diameter.Name() + "\t" +
                               intensity.Name() );
            // Print the analysis results for 10% of the particles
            for ( int i = 0; i < ( int )( particleCount / 10 ); i++ )
            {
                Console.WriteLine( ( i + 1 ) + "\t\t" + centerX.Value( i ).ToString( "0.00" ) + "\t\t" +
                                   centerY.Value( i ).ToString( "0.00" ) + "\t\t" +
                                   diameter.Value( i ).ToString( "0.00" ) + "\t\t\t" +
                                   intensity.Value( i ).ToString( "0.00" ) );
            }

            // Save the created image with IOFormat
            ViewIO.WriteView( imageBdk, @"T06_01_output.png" );

            // ImageDev library finalization
            Initialization.Finish();
        }
    }
}
import imagedev
import imagedev_data
import ioformat

# Initialize the ImageDev library if not done
if (imagedev.is_initialized() == False): imagedev.init()

# Open and display a tif file
image_input = ioformat.read_image(imagedev_data.get_image_path("polystyrene.tif"))

# Threshold the grayscale image
image_thr = imagedev.thresholding_by_criterion(\
  image_input, imagedev.ThresholdingByCriterion.ComparisonCriterion.GREATER_THAN, 128)

# Separate connected particles
image_sep = imagedev.separate_objects(image_thr, 2)
image_thr = None

# Remove particles touching image borders
image_bdk = imagedev.border_kill(image_sep)
image_sep = None

# Connected component labeling of a binary image
image_lab = imagedev.labeling_2d(\
  image_bdk, imagedev.Labeling2d.LabelType.LABEL_8_BIT, imagedev.Labeling2d.Neighborhood.CONNECTIVITY_8)

# The number of particles is the maximum label
extrema = imagedev.intensity_extrema(image_lab, 0)
particle_count = int(extrema.maximum(0, 0, 0))

# Define the analysis features to be computed
analysis = imagedev.AnalysisMsr()
center_x = analysis.select(imagedev.native_measurements.BarycenterX)
center_y = analysis.select(imagedev.native_measurements.BarycenterY)
diameter = analysis.select(imagedev.native_measurements.EquivalentDiameter)
intensity = analysis.select(imagedev.native_measurements.IntensityMean)

# Launch the feature extraction on the segmented image
imagedev.label_analysis(image_lab, image_input, analysis)
print("Number of particles = " + str(particle_count))
print("Particle\t" + center_x.name + "\t" + center_y.name + "\t" + diameter.name + "\t" + intensity.name)
# Print the analysis results for 10% of the particles
for i in range(int(particle_count/10)):
  print(str(i+1) + '\t\t\t' + "{:.2f}".format(center_x.value(i)) +'\t\t' + "{:.2f}".format(center_y.value(i)) +\
    '\t\t' + "{:.2f}".format(diameter.value(i)) + '\t\t\t\t' + "{:.2f}".format(intensity.value(i)))

# Save the created image with IOFormat
ioformat.write_view(image_lab, "T06_01_output.png")

# ImageDev library finalization
imagedev.finish()
See also