Edge Detection
This category contains algorithms for extracting image edges.
- Gradient: This group provides first-order derivative operators.
- Laplacian: This group provides second order derivative operators.
- Other Derivatives: This group provides miscellaneous derivative based operators.
- Edge Marking: This group provides operators for segmenting or sharpening edges.
An edge, also known as a discontinuity, in a signal is usually defined as a
transition in the intensity or amplitude of that signal. Edge detection is based
upon the detection of local discontinuities that mainly correspond to the
boundaries of objects in an image.
Typically, an ideal one-dimensional edge can be defined as a step from low to high intensity, as in Figure 1. In practice, the signal is usually corrupted by noise. In which case, the edge is defined as the transition from an average low to an average high intensity. Such edges are characterized by their contrast (difference between high and low intensity), and their width or rate-of-change.
These measures differentiate between sharp and smooth edges.
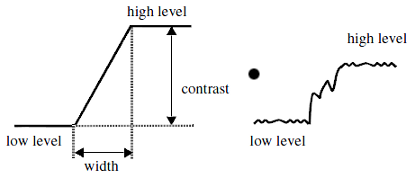
Figure 1. One-dimensional edge model
In two dimensions, the discontinuities occur along certain lines or orientations.
Figure 2 depicts a two-dimensional step or ramp edge. As in the one-dimensional case, a width or rate-of change, and a contrast can be defined. In addition, the local orientation feature is important in characterizing two-dimensional edges.
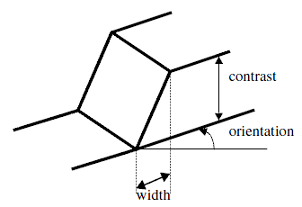
Figure 2. Two-dimensional step edge
Notice: This model is not unique, and other definitions exist using the transition profile or the color and texture properties. Some examples of these edges are shown in the Figure 3, although their presentation is beyond the scope of this manual, where we primarily investigate luminance edges.
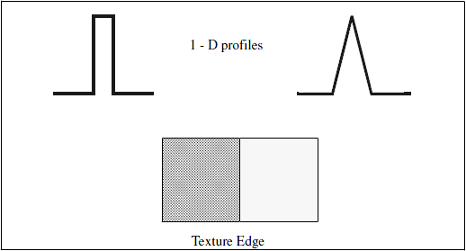
Figure 3. Other edge models
In the one-dimensional case (Figure 4-a), the transition point can be marked as the maximum of the first-order derivative (Figure 4-b), or the zero-crossing of the second-order derivative (Figure 4-c).
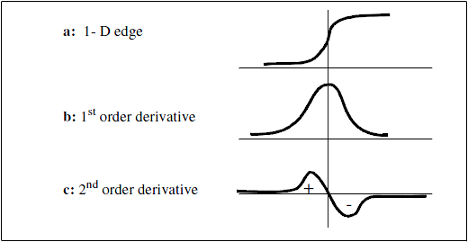
Figure 4. One-dimensional function and its derivatives
Notice: The first-order derivative is higher for a sharp transition profile than for a smooth transition, as shown in Figure 5.
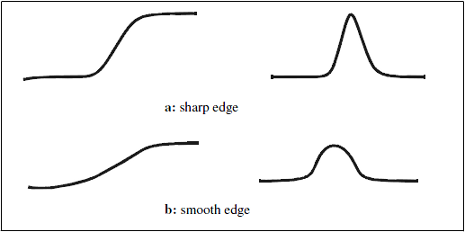
Figure 5. Sharp and smooth edges
These facts suggest a strategy for edge detection:
Typically, an ideal one-dimensional edge can be defined as a step from low to high intensity, as in Figure 1. In practice, the signal is usually corrupted by noise. In which case, the edge is defined as the transition from an average low to an average high intensity. Such edges are characterized by their contrast (difference between high and low intensity), and their width or rate-of-change.
These measures differentiate between sharp and smooth edges.
Figure 1. One-dimensional edge model
In two dimensions, the discontinuities occur along certain lines or orientations.
Figure 2 depicts a two-dimensional step or ramp edge. As in the one-dimensional case, a width or rate-of change, and a contrast can be defined. In addition, the local orientation feature is important in characterizing two-dimensional edges.
Figure 2. Two-dimensional step edge
Notice: This model is not unique, and other definitions exist using the transition profile or the color and texture properties. Some examples of these edges are shown in the Figure 3, although their presentation is beyond the scope of this manual, where we primarily investigate luminance edges.
Figure 3. Other edge models
In the one-dimensional case (Figure 4-a), the transition point can be marked as the maximum of the first-order derivative (Figure 4-b), or the zero-crossing of the second-order derivative (Figure 4-c).
Figure 4. One-dimensional function and its derivatives
Notice: The first-order derivative is higher for a sharp transition profile than for a smooth transition, as shown in Figure 5.
Figure 5. Sharp and smooth edges
These facts suggest a strategy for edge detection:
- Enhance local edges using differentiation,
- Threshold the result so that only the points of a sufficiently large derivative are retained as edge points.