DrawRectanglesColor2d
Draws a list of color rectangles on a two-dimensional image.
Access to parameter description
This algorithm draws multiple rectangles based on the given center positions, side sizes and rotations in the given colors. The rectangles can be filled or just the outline.
The rectangles are defined by a dataframe containing the following columns. The order of the columns is not important but they have the specified column names.
Each column must have the DOUBLE DataType. If a column is not filled its default value will be used.
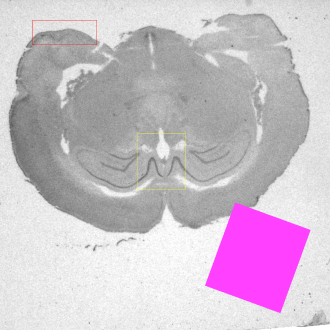
(a)
\begin{array}{|l|l|l|l||l|l|l|l|l|} \hline \textbf{centerX} & \textbf{centerY} & \textbf{sideX} & \textbf{sideY} & \textbf{rotation} & \textbf{valueR} & \textbf{valueG} & \textbf{valueB} & \textbf{isFilled} \\ \hline 200 & 100 & 200 & 75 & - & - & - & - & - \\ \hline 500 & 500 & 150 & 175 & - & - & 255 & 32 & - \\ \hline 800 & 800 & 250 & 275 & 20 & 255 & 64 & 255 & 1 \\ \hline \end{array}
See also
Access to parameter description
This algorithm draws multiple rectangles based on the given center positions, side sizes and rotations in the given colors. The rectangles can be filled or just the outline.
The rectangles are defined by a dataframe containing the following columns. The order of the columns is not important but they have the specified column names.
Each column must have the DOUBLE DataType. If a column is not filled its default value will be used.
- centerX: The X coordinate of the rectangle, in pixels. The default value is 0.
- centerY: The Y coordinate of the rectangle, in pixels. The default value is 0.
- sideX: The X side size of the rectangle before applying the rotation, in pixels. It must be greater than or equal to 1. The default value is 0.
- sideY: The Y side size of the rectangle before applying the rotation, in pixels. It must be greater than or equal to 1. The default value is 0.
- rotation: The rotation angle to apply around the rectangle center, in degrees. The default value is 0.
- valueR: The red component of the rectangle color between 0 and 255. The default value is 255.
- valueG: The green component of the rectangle color 0 and 255. The default value is 0.
- valueB: The blue component of the rectangle color. The default value is 0.
- isFilled: Only the outline of the rectangle is drawn if this parameter is set to 0; in other cases, it is filled.
(a)
\begin{array}{|l|l|l|l||l|l|l|l|l|} \hline \textbf{centerX} & \textbf{centerY} & \textbf{sideX} & \textbf{sideY} & \textbf{rotation} & \textbf{valueR} & \textbf{valueG} & \textbf{valueB} & \textbf{isFilled} \\ \hline 200 & 100 & 200 & 75 & - & - & - & - & - \\ \hline 500 & 500 & 150 & 175 & - & - & 255 & 32 & - \\ \hline 800 & 800 & 250 & 275 & 20 & 255 & 64 & 255 & 1 \\ \hline \end{array}
See also
Function Syntax
This function returns outputColorImage.
// Function prototype
std::shared_ptr< iolink::ImageView >
drawRectanglesColor2d( std::shared_ptr< iolink::ImageView > inputImage,
                       std::shared_ptr< const iolink::DataFrameView > table,
                       std::shared_ptr< iolink::ImageView > outputColorImage = nullptr );
This function returns outputColorImage.
// Function prototype.
draw_rectangles_color_2d(input_image: idt.ImageType,
                         table: Union[iolink.DataFrameView, None] = None,
                         output_color_image: idt.ImageType = None) -> idt.ImageType
This function returns outputColorImage.
// Function prototype.
public static IOLink.ImageView
DrawRectanglesColor2d( IOLink.ImageView inputImage,
                       IOLink.DataFrameView table = null,
                       IOLink.ImageView outputColorImage = null );
Class Syntax
Parameters
| Parameter Name | Description | Type | Supported Values | Default Value | |
|---|---|---|---|---|---|
 |
inputImage |
The input grayscale or RGB image. | Image | Grayscale or Multispectral | nullptr |
|
table |
The dataframe describing all rectangles to draw with columns centerX, centerY, sideX, sideY, rotation, valueR, valueG, valueB and isFilled.
All values must have the DOUBLE DataType. |
DataFrameViewConst | nullptr | |
 |
outputColorImage |
The output RGB image. Its size and type are forced to the same values as the input. | Image | nullptr | |
| Parameter Name | Description | Type | Supported Values | Default Value | |
|---|---|---|---|---|---|
|
input_image |
The input grayscale or RGB image. | image | Grayscale or Multispectral | None |
|
table |
The dataframe describing all rectangles to draw with columns centerX, centerY, sideX, sideY, rotation, valueR, valueG, valueB and isFilled.
All values must have the DOUBLE DataType. |
data_frame_view_const | None | |
|
output_color_image |
The output RGB image. Its size and type are forced to the same values as the input. | image | None | |
| Parameter Name | Description | Type | Supported Values | Default Value | |
|---|---|---|---|---|---|
|
inputImage |
The input grayscale or RGB image. | Image | Grayscale or Multispectral | null |
|
table |
The dataframe describing all rectangles to draw with columns centerX, centerY, sideX, sideY, rotation, valueR, valueG, valueB and isFilled.
All values must have the DOUBLE DataType. |
DataFrameViewConst | null | |
|
outputColorImage |
The output RGB image. Its size and type are forced to the same values as the input. | Image | null | |
Object Examples
auto polystyrene = ioformat::readImage( std::string( IMAGEDEVDATA_IMAGES_FOLDER ) + "polystyrene.tif" );
auto drawRectanglesDataframeView = ioformat::openView( std::string( IMAGEDEVDATA_OBJECTS_FOLDER ) + "drawRectanglesDataframe.csv" );
auto drawRectanglesDataframe = iolink::DataFrameViewProvider::toDataFrame( drawRectanglesDataframeView );

DrawRectanglesColor2d drawRectanglesColor2dAlgo;
drawRectanglesColor2dAlgo.setInputImage( polystyrene );
drawRectanglesColor2dAlgo.setTable( drawRectanglesDataframe );
drawRectanglesColor2dAlgo.execute();

std::cout << "outputColorImage:" << drawRectanglesColor2dAlgo.outputColorImage()->toString();
polystyrene = ioformat.read_image(imagedev_data.get_image_path("polystyrene.tif"))
draw_rectangles_dataframe = iolink.DataFrameViewProvider.to_data_frame(ioformat.open_view(imagedev_data.get_object_path("drawRectanglesDataframe.csv")))

draw_rectangles_color_2d_algo = imagedev.DrawRectanglesColor2d()
draw_rectangles_color_2d_algo.input_image = polystyrene
draw_rectangles_color_2d_algo.table = draw_rectangles_dataframe
draw_rectangles_color_2d_algo.execute()

print("output_color_image:", str(draw_rectangles_color_2d_algo.output_color_image))
ImageView polystyrene = ViewIO.ReadImage( @"Data/images/polystyrene.tif" );
var drawRectanglesDataframeView = IOFormat.ViewIO.OpenView(  @"Data/objects/drawRectanglesDataframe.csv" );
var drawRectanglesDataframe = IOLink.DataFrameViewProvider.ToDataFrame( drawRectanglesDataframeView );

DrawRectanglesColor2d drawRectanglesColor2dAlgo = new DrawRectanglesColor2d
{
    inputImage = polystyrene,
    table = drawRectanglesDataframe
};
drawRectanglesColor2dAlgo.Execute();

Console.WriteLine( "outputColorImage:" + drawRectanglesColor2dAlgo.outputColorImage.ToString() );
Function Examples
auto polystyrene = ioformat::readImage( std::string( IMAGEDEVDATA_IMAGES_FOLDER ) + "polystyrene.tif" );
auto drawRectanglesDataframeView = ioformat::openView( std::string( IMAGEDEVDATA_OBJECTS_FOLDER ) + "drawRectanglesDataframe.csv" );
auto drawRectanglesDataframe = iolink::DataFrameViewProvider::toDataFrame( drawRectanglesDataframeView );

auto result = drawRectanglesColor2d( polystyrene, drawRectanglesDataframe );

std::cout << "outputColorImage:" << result->toString();
polystyrene = ioformat.read_image(imagedev_data.get_image_path("polystyrene.tif"))
draw_rectangles_dataframe = iolink.DataFrameViewProvider.to_data_frame(ioformat.open_view(imagedev_data.get_object_path("drawRectanglesDataframe.csv")))

result = imagedev.draw_rectangles_color_2d(polystyrene, draw_rectangles_dataframe)

print("output_color_image:", str(result))
ImageView polystyrene = ViewIO.ReadImage( @"Data/images/polystyrene.tif" );
var drawRectanglesDataframeView = IOFormat.ViewIO.OpenView(  @"Data/objects/drawRectanglesDataframe.csv" );
var drawRectanglesDataframe = IOLink.DataFrameViewProvider.ToDataFrame( drawRectanglesDataframeView );

IOLink.ImageView result = Processing.DrawRectanglesColor2d( polystyrene, drawRectanglesDataframe );

Console.WriteLine( "outputColorImage:" + result.ToString() );
© 2026 Thermo Fisher Scientific Inc. All rights reserved.